Homebuyer demand for condos dropped with the coronavirus pandemic, but buyers are starting to return—particularly those searching for affordable homes. Demand for single-family homes has recovered more quickly.
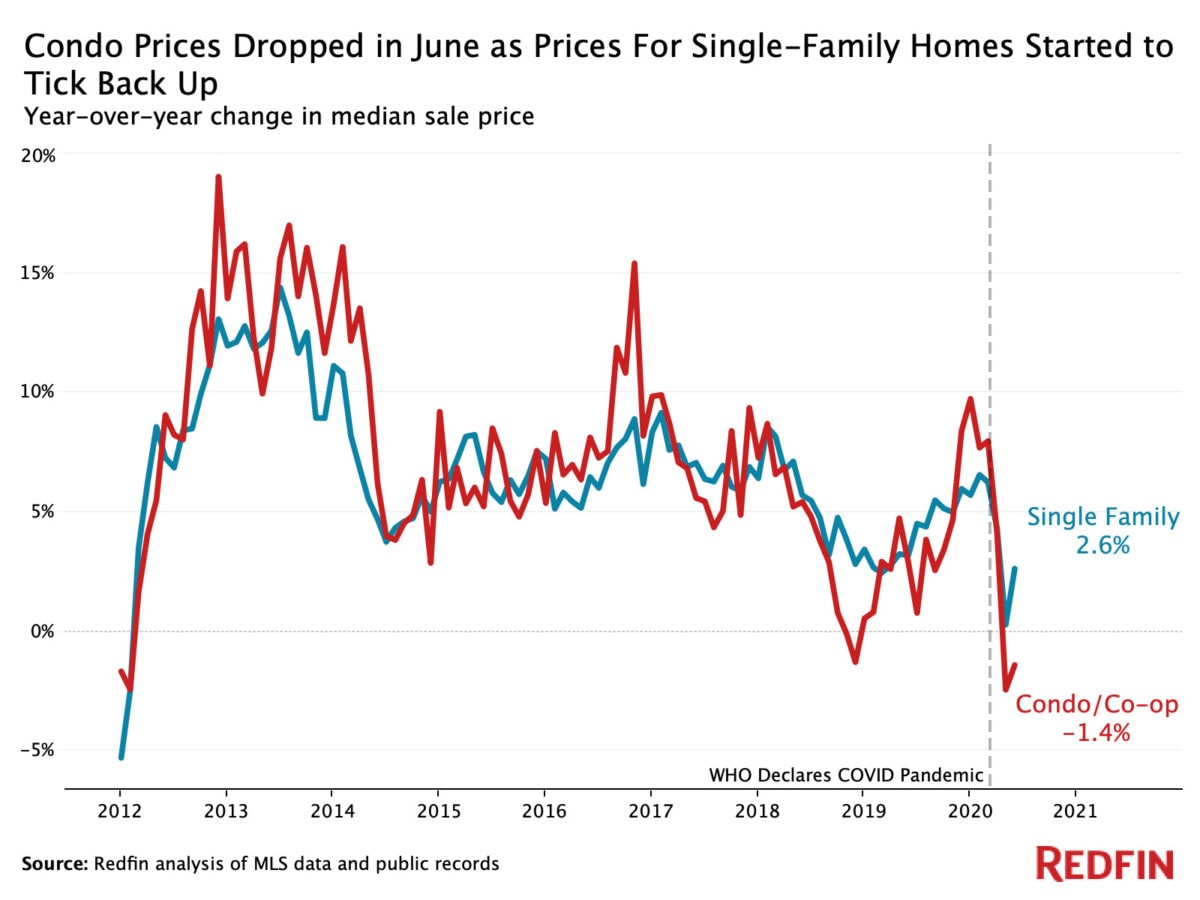
Condo sale prices nationwide dropped 1.4% year over year to a median of $252,000 in June, the second consecutive month of drops after nearly two years of rising prices. Price growth for condos had reached a three-year high in January with a 9.7% year-over-year increase.
Contrast that with single-family homes, which saw their median sale price rise 2.6% year over year to $322,000 in June. Price growth for both condos (-2.4%) and single-family homes (+0.3%) bottomed out in May after the pandemic slowed housing activity to a near halt.
“The pandemic has fundamentally changed what a lot of buyers are looking for in a home,” said Redfin economist Taylor Marr. “People are spending more time at home and less time at the office or school, and that means buyers want more space and private yards. And because of concerns about the virus, they aren’t as interested in shared amenities like elevators, community pools and gyms, which have traditionally been benefits of condo living. But condos tend to be more affordable than single-family homes, especially now with historically low mortgage rates and the fact that condo prices are down from last year while they’re up for single-family homes. Those factors are motivating some buyers to jump back into the condo market, particularly those who have found that purchasing a condo is just as affordable as renting an apartment.”
Market Summary, June 2020
| Condos | Single-family homes | |
|---|---|---|
| Median sale price | $252,000 | $322,000 |
| Median sale price, YoY | -1.4% | 2.6% |
| Homes sold, seasonally adjusted, YoY | -31.3% | -11.9% |
| Pending sales, seasonally adjusted, YoY | -4% | 6.1% |
| New listings, seasonally adjusted, YoY | 1.9% | -13.5% |
| All homes for sale, seasonally adjusted, YoY | -6.7% | -24.1% |
| Median days on market | 43 | 39 |
| Months of supply | 3.1 | 1.9 |
| Sold above list | 18.3% | 27.5% |
Condo sales were down in June, but pending sales indicate buyers are coming back
Condo sales fell 31.3% year over year in June on a seasonally adjusted basis, following a 53.5% drop in May when sales growth bottomed out. Single-family home sales are experiencing smaller drops, with an 11.9% year-over-year decline in June after a 27.6% drop at their low point in May.
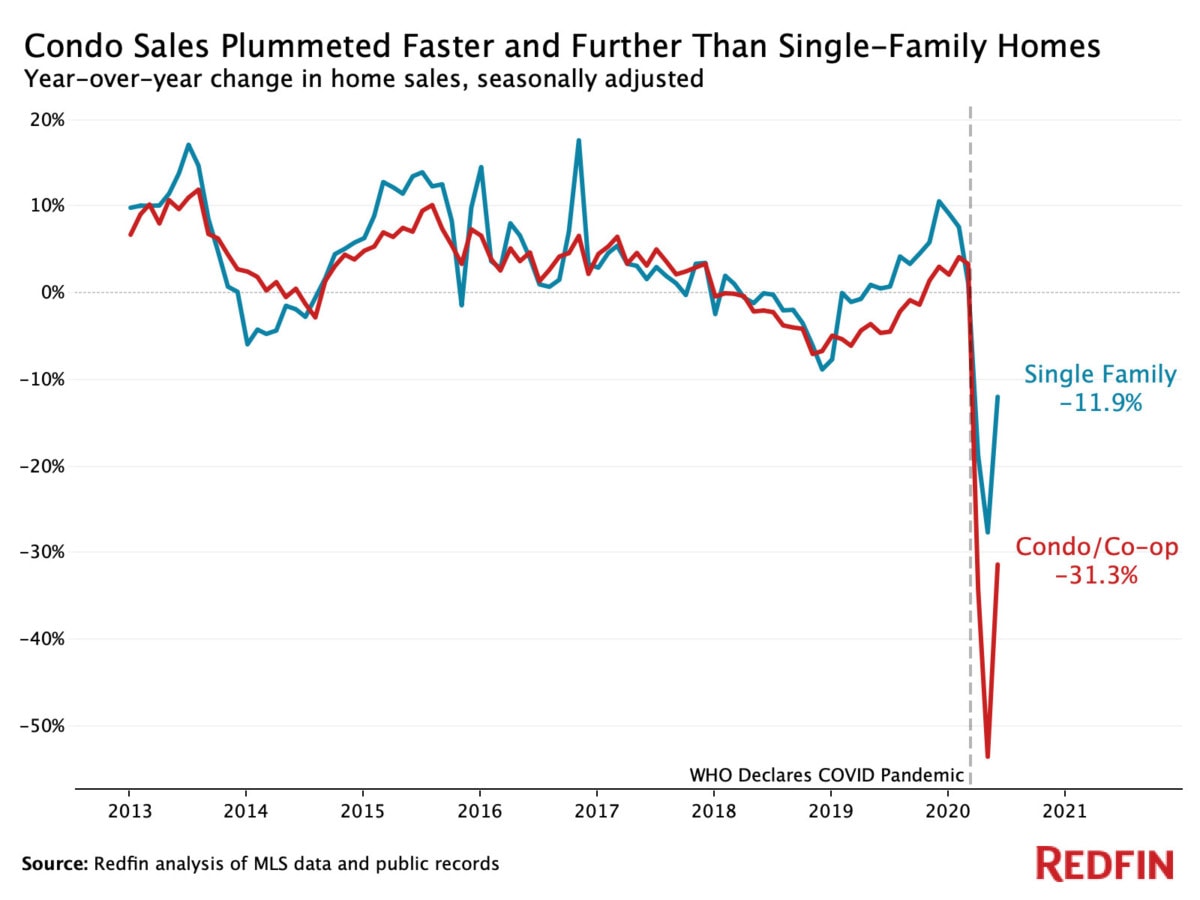
Pending condo sales were down 4% year over year on a seasonally adjusted basis in June, an uptick from the 46.1% drop when growth bottomed out in April. The recovery in pending sales indicates that demand for condos is returning, albeit less so than for single-family homes, which posted a 6.1% year-over-year increase in June, up from a 28.3% decline at their low point in April.
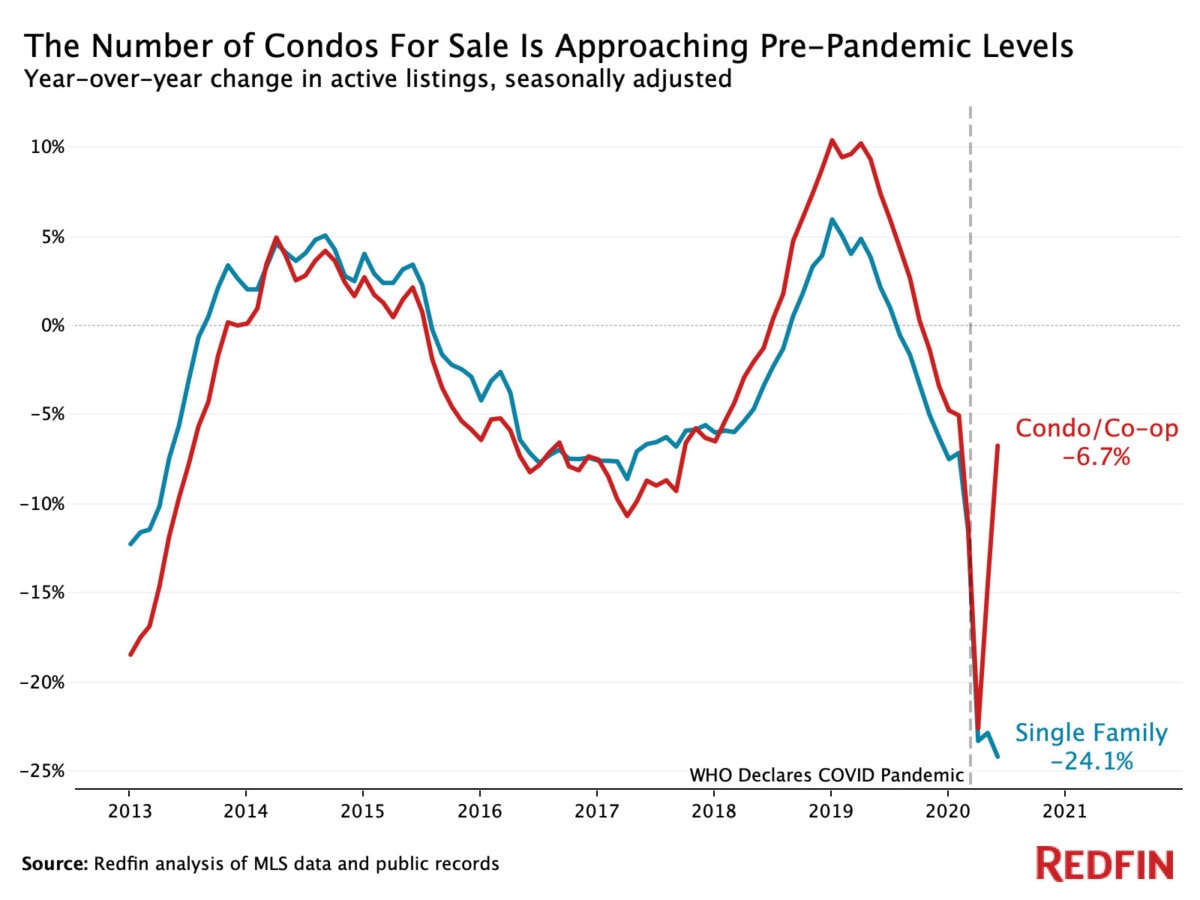
Condo supply recovered to near pre-pandemic levels, but it’s still down compared with last year
The number of condos for sale fell 6.7% year over year in June on a seasonally adjusted basis, close to the 5% drop before the pandemic in February. It bottomed out in April with a 22.6% annual drop. New condo listings rose 1.9% year over year in June after bottoming out with a 47.1% fall in April.
The number of single-family homes for sale continued to drop in June, down 24.1% year over year. New listings of single-family homes dipped 13.5% year over year, versus a 38.9% drop when they bottomed out in April.
“Right now we have a mixed bag of buyers. Condo buyers are more hesitant and taking longer to make decisions than people who are looking at single-family homes,” said San Francisco Redfin agent Carlos Barrientos. “People who want a condo are less confident that the space will be comfortable to live and work long-term, and they’re worried about the investment. The people who are going through with condo purchases are doing it because that’s what they can afford.”
There’s competition for condos—but there’s more for single-family homes
Just over 41% of condos went off the market in two weeks in June, up from 35.5% a year before and more than any month since February 2018. Nearly 47% of single-family homes went off the market in two weeks in June, up from 38.1% in June 2019 and the highest share in at least eight years.
Just over 40% of Redfin offers for condos faced competition in June, while more than 56% of single-family homes were part of bidding wars.
“Condos aren’t flying off the shelves like single-family homes, but I’ve helped buyers with several recent condo deals,” said Tony Orlando, a Redfin agent in Detroit. “Because condos tend to be more affordable, they still appeal to people looking for less expensive homes and they’re often attractive to first-time homebuyers, people who live alone and buyers looking to downsize and have a maintenance-free lifestyle.”
Metro-level highlights: Condos
To be included in the metro-level section, metro areas must have a population of at least 1.5 million and at least 100 condo sales in June. The New York metro area was excluded from this analysis due to limited data availability.
Prices
- The median sale price for condos declined in the majority of metros included in this report.
- Condo prices dropped most in Minneapolis in June, with a 9.6% year over year drop to a median of $174,580. “The lackluster condo market in Minneapolis is mainly due to the pandemic and continuing social unrest,” said local Redfin agent Bridgette Prew. “With so much uncertainty around COVID-19 and whether or not schools are reopening in the fall, along with the potential disbanding of the police, homebuyers are slow to move into small spaces in shared condo buildings. Investors are also nervous about investing in condos right now because of a lack of renters willing to move into densely populated areas, which is where condos tend to be located. In the past, condos in Minneapolis sold pretty quickly.”
- Oakland (down 8.6% year over year to $477,751) and San Francisco (down 7.4% year over year to $1,048,473) experienced the next-biggest condo price drops.
- The median sale price for condos increased the most in Tampa, up 15.2% year over year to $159,217; Nashville, up 13.1% to $309,950; and Virginia Beach, up 12.3% to $219,000.
Sales
- Condo sales increased year over year in just two of the metros included in this analysis: Dallas, where sales were up 8.9% year over year on a seasonally adjusted basis, and Virginia Beach, up 3.5%.
- Condo sales dropped most in Miami, with a 57.7% year-over-year decline on a seasonally adjusted basis, Fort Lauderdale, FL (-55%) and Warren, MI (-53.4%).
New listings
- New listings rose most in San Francisco, with a 60.8% year-over-year increase, followed by Nassau County, NY (23.3%) and Austin (21.1%).
- New listings dropped most in St. Louis, with a 35.4% annual drop, Las Vegas (-25.4%) and Columbus, OH (-24.8%).
Supply
- The total number of condos for sale jumped most in San Francisco, 39.8% year over year on a seasonally adjusted basis in June, Austin (9.5%) and Atlanta (8.6%).
- Supply declined most in St. Louis, with a 28.7% year-over-year drop in June, Cleveland (-27.9%) and Anaheim (-27.4%).
Below are market-by-market breakdowns for prices, inventory, new listings and sales for markets with at least 100 condo sales in June. For downloadable data on all of the markets Redfin tracks, visit the Redfin Data Center.
Median sale price, June 2020
| Redfin metro | Median sale price | Month over month | Year over year |
|---|---|---|---|
| Anaheim, CA | $497,330 | 8.5% | 7.5% |
| Atlanta, GA | $217,259 | -0.1% | 3.8% |
| Austin, TX | $304,697 | -8.2% | 7.3% |
| Baltimore, MD | $195,000 | -2.3% | -0.2% |
| Boston, MA | $479,482 | 1.2% | -3.8% |
| Chicago, IL | $216,122 | -1.8% | 0.3% |
| Cincinnati, OH | $144,079 | 0.9% | -0.5% |
| Cleveland, OH | $126,076 | 4.9% | 4.8% |
| Columbus, OH | $182,304 | 2.7% | 7.6% |
| Dallas, TX | $191,300 | 2.2% | -4.7% |
| Denver, CO | $271,976 | -2.0% | 2.1% |
| Detroit, MI | $163,405 | -14.6% | 1.6% |
| Fort Lauderdale, FL | $144,664 | -0.3% | 1.3% |
| Houston, TX | $127,975 | 13.0% | -1.8% |
| Indianapolis, IN | $165,885 | 0.3% | 4.2% |
| Las Vegas, NV | $164,900 | -0.1% | 3.4% |
| Los Angeles, CA | $468,588 | 0.5% | -3.0% |
| Miami, FL | $236,192 | 0.6% | 4.4% |
| Milwaukee, WI | $196,879 | 2.7% | 5.1% |
| Minneapolis, MN | $174,580 | -3.4% | -9.6% |
| Nashville, TN | $309,950 | 2.5% | 13.1% |
| Nassau County, NY | $287,901 | -6.3% | -5.7% |
| New Brunswick, NJ | $255,826 | 7.3% | 10.8% |
| Oakland, CA | $477,751 | 3.7% | -8.6% |
| Orlando, FL | $138,523 | -1.6% | 1.4% |
| Phoenix, AZ | $202,639 | 0.6% | 8.9% |
| Portland, OR | $271,185 | -1.0% | -0.1% |
| Providence, RI | $227,303 | 3.1% | 7.1% |
| Riverside, CA | $277,914 | -1.6% | -6.6% |
| Sacramento, CA | $260,000 | 3.0% | 4.4% |
| San Diego, CA | $417,391 | -2.4% | -2.7% |
| San Francisco, CA | $1,048,473 | 5.6% | -7.4% |
| San Jose, CA | $702,301 | 2.5% | -5.9% |
| Seattle, WA | $386,440 | -0.3% | 2.9% |
| St. Louis, MO | $157,106 | 3.6% | 7.9% |
| Tampa, FL | $159,217 | 4.5% | 15.2% |
| Virginia Beach, VA | $219,000 | 1.4% | 12.3% |
| Warren, MI | $159,268 | -3.4% | -1.6% |
| Washington, D.C. | $330,777 | -2.5% | 3.5% |
Condos sold, June 2020
| Redfin metro | Number of condos sold, seasonally adjusted | Month over month | Year over year |
|---|---|---|---|
| Anaheim, CA | 423 | 26.8% | -39.2% |
| Atlanta, GA | 426 | 48.5% | -29.4% |
| Austin, TX | 222 | 76.7% | -10.7% |
| Baltimore, MD | 182 | 17.1% | -9.9% |
| Boston, MA | 576 | 5.5% | -39.5% |
| Chicago, IL | 1218 | 7.0% | -37.9% |
| Cincinnati, OH | 199 | 13.9% | -19.2% |
| Cleveland, OH | 187 | 11.9% | -17.3% |
| Columbus, OH | 315 | 8.2% | -10.3% |
| Dallas, TX | 216 | 82.8% | 8.9% |
| Denver, CO | 660 | 61.8% | -10.8% |
| Detroit, MI | 125 | 58.0% | -42.1% |
| Fort Lauderdale, FL | 525 | 8.6% | -55.0% |
| Houston, TX | 204 | 30.1% | -13.8% |
| Indianapolis, IN | 180 | 9.3% | -16.0% |
| Las Vegas, NV | 232 | 12.3% | -47.4% |
| Los Angeles, CA | 499 | 18.2% | -41.5% |
| Miami, FL | 410 | 19.2% | -57.7% |
| Milwaukee, WI | 220 | -0.3% | -20.9% |
| Minneapolis, MN | 225 | 5.6% | -34.0% |
| Nashville, TN | 121 | -15.1% | -32.8% |
| Nassau County, NY | 185 | -19.6% | -39.7% |
| New Brunswick, NJ | 224 | -6.3% | -42.5% |
| Oakland, CA | 180 | 57.3% | -42.3% |
| Orlando, FL | 279 | 43.3% | -34.4% |
| Phoenix, AZ | 576 | 55.1% | -2.6% |
| Portland, OR | 223 | 45.0% | -23.4% |
| Providence, RI | 135 | -10.3% | -42.1% |
| Riverside, CA | 310 | 48.4% | -31.8% |
| Sacramento, CA | 110 | 27.5% | -43.1% |
| San Diego, CA | 546 | 17.2% | -27.8% |
| San Francisco, CA | 156 | 37.9% | -48.8% |
| San Jose, CA | 111 | 58.3% | -35.2% |
| Seattle, WA | 418 | 15.3% | -22.3% |
| St. Louis, MO | 251 | 23.1% | -15.4% |
| Tampa, FL | 750 | 73.3% | -6.5% |
| Virginia Beach, VA | 235 | 19.7% | 3.5% |
| Warren, MI | 303 | 28.0% | -53.4% |
| Washington, D.C. | 717 | 15.6% | -21.1% |
New listings, June 2020
| Redfin metro | Number of new listings, seasonally adjusted | Month over month | Year over year |
|---|---|---|---|
| Anaheim, CA | 698 | 23.4% | -5.0% |
| Atlanta, GA | 741 | 9.3% | 6.9% |
| Austin, TX | 357 | 19.9% | 21.1% |
| Baltimore, MD | 244 | 8.9% | -13.4% |
| Boston, MA | 1182 | 13.0% | 3.5% |
| Chicago, IL | 2777 | 39.2% | 4.6% |
| Cincinnati, OH | 246 | 7.6% | 3.0% |
| Cleveland, OH | 259 | 15.2% | -1.8% |
| Columbus, OH | 332 | -2.0% | -24.8% |
| Dallas, TX | 380 | -4.3% | 3.4% |
| Denver, CO | 827 | -1.8% | 0.9% |
| Detroit, MI | 265 | 17.6% | 10.3% |
| Fort Lauderdale, FL | 1478 | 13.5% | -4.3% |
| Houston, TX | 401 | 13.0% | 2.9% |
| Indianapolis, IN | 202 | -1.6% | 2.5% |
| Las Vegas, NV | 441 | 5.6% | -25.4% |
| Los Angeles, CA | 1105 | 21.4% | 2.5% |
| Miami, FL | 1978 | 31.8% | 10.5% |
| Milwaukee, WI | 293 | 2.5% | 6.3% |
| Minneapolis, MN | 385 | 20.5% | 0.6% |
| Nashville, TN | 236 | 3.1% | 8.8% |
| Nassau County, NY | 458 | 143.5% | 23.3% |
| New Brunswick, NJ | 478 | 23.3% | 7.8% |
| Oakland, CA | 340 | 0.3% | -4.1% |
| Orlando, FL | 514 | 13.4% | 0.9% |
| Phoenix, AZ | 665 | 5.7% | 3.2% |
| Portland, OR | 316 | 4.9% | 0.3% |
| Providence, RI | 213 | 7.0% | -19.8% |
| Riverside, CA | 563 | 9.1% | 11.8% |
| Sacramento, CA | 199 | 21.0% | 8.8% |
| San Diego, CA | 740 | 0.3% | -20.0% |
| San Francisco, CA | 501 | 17.6% | 60.8% |
| San Jose, CA | 199 | 10.8% | -8.3% |
| Seattle, WA | 587 | 3.8% | -7.8% |
| St. Louis, MO | 226 | -5.8% | -35.4% |
| Tampa, FL | 975 | 5.7% | 3.4% |
| Virginia Beach, VA | 249 | -5.8% | -10.8% |
| Warren, MI | 714 | 4.7% | -9.8% |
| Washington, D.C. | 1100 | 27.0% | 6.8% |
All condos for sale, June 2020
| Redfin metro | Number of active listings, seasonally adjusted | Month over month | Year over year |
|---|---|---|---|
| Anaheim, CA | 2399 | 8.5% | -27.4% |
| Atlanta, GA | 2593 | 4.5% | 8.6% |
| Austin, TX | 1064 | 5.3% | 9.5% |
| Baltimore, MD | 824 | 5.7% | -10.0% |
| Boston, MA | 3160 | 9.1% | 1.9% |
| Chicago, IL | 9053 | 0.4% | -11.6% |
| Cincinnati, OH | 761 | 3.6% | -8.7% |
| Cleveland, OH | 710 | 0.8% | -27.9% |
| Columbus, OH | 1153 | -1.2% | -10.6% |
| Dallas, TX | 1563 | 6.0% | 3.1% |
| Denver, CO | 2220 | 0.6% | 2.5% |
| Detroit, MI | 862 | 8.4% | 8.4% |
| Fort Lauderdale, FL | 7416 | 6.0% | -6.3% |
| Houston, TX | 1622 | 1.3% | -0.1% |
| Indianapolis, IN | 555 | -2.0% | -3.4% |
| Las Vegas, NV | 2071 | 5.2% | -16.5% |
| Los Angeles, CA | 3656 | 8.9% | -9.7% |
| Miami, FL | 11166 | 5.0% | -7.0% |
| Milwaukee, WI | 990 | 7.0% | 7.3% |
| Minneapolis, MN | 1051 | 6.5% | 3.4% |
| Nashville, TN | 911 | 6.0% | 5.8% |
| Nassau County, NY | 1305 | 34.2% | -14.8% |
| New Brunswick, NJ | 1436 | 7.1% | -16.8% |
| Oakland, CA | 937 | 5.4% | 3.9% |
| Orlando, FL | 1810 | 6.5% | 7.8% |
| Phoenix, AZ | 2016 | 2.3% | -3.0% |
| Portland, OR | 1075 | 1.9% | -12.5% |
| Providence, RI | 790 | 1.0% | -24.1% |
| Riverside, CA | 2050 | 9.9% | -9.4% |
| Sacramento, CA | 551 | 6.3% | -4.4% |
| San Diego, CA | 2216 | -0.6% | -21.8% |
| San Francisco, CA | 1209 | 14.2% | 39.8% |
| San Jose, CA | 636 | 10.2% | -13.6% |
| Seattle, WA | 1547 | 5.6% | -16.9% |
| St. Louis, MO | 712 | -5.4% | -28.7% |
| Tampa, FL | 3342 | 1.9% | -0.5% |
| Virginia Beach, VA | 816 | -3.1% | -24.6% |
| Warren, MI | 2062 | 1.8% | -2.8% |
| Washington, D.C. | 2779 | 9.6% | 6.2% |
The post Condo Prices Down 1.4% in June, Sales Down 31%, But Demand Is Ticking Up appeared first on Redfin | Real Estate Tips for Home Buying, Selling & More.