Only half of Black families own their home in Washington, DC, which has the highest Black homeownership rate in the U.S., versus more than 70% of white families. Nationwide, the gap is 44% versus 73.7%.
Just 44% of Black families own the home they live in as of the first quarter of 2020, up from 41.1% in the first quarter of 2019, an increase that may reverse as the coronavirus pandemic upends one of the “most promising economies in recent memory” for Black Americans. For white families, the national homeownership rate is 73.7%, up slightly from 73.2% in the first quarter of 2019. The word “family” and “household” are used interchangeably in this report to refer to people living in housing units together.
“The homeownership gap between Black and white families is a problem that extends far beyond the realm of housing,” said Redfin economist Taylor Marr. “The value many Black families have missed out on because they were impacted by systemic racism in housing could have been passed down to children and grandchildren, paying for things like higher education, childcare, starting a business and down payments on their own home. Instead, younger generations in the Black community are at an unfair financial and social disadvantage.”
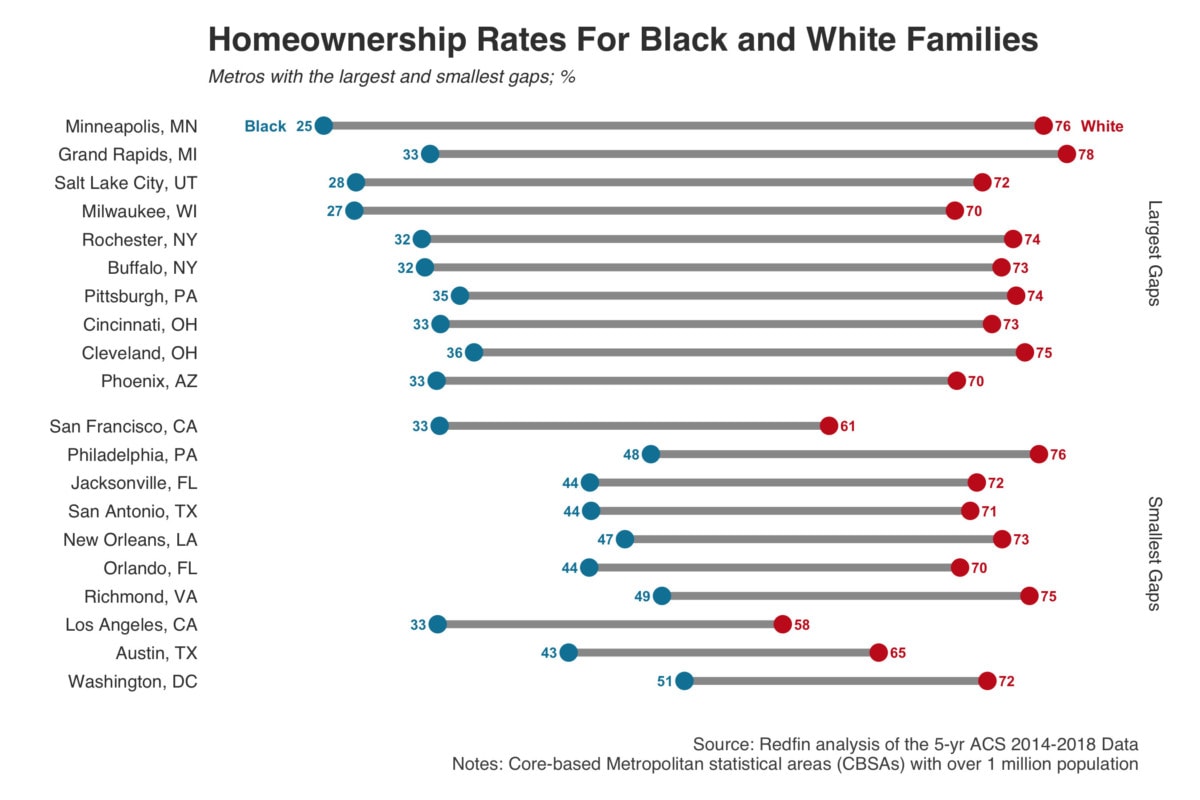
Metros with the lowest and highest homeownership rates for Black families
Just 25% of Black families in Minneapolis own their home, the lowest Black homeownership rate of any metro area in the U.S. with more than 1 million residents. It’s followed by Milwaukee and Salt Lake City, where only 27% and 28% of Black families own the home they live in, respectively.
Those three metros, all with median home-sale prices below $325,000, are also three of the four metros with the biggest racial homeownership gaps. In Minneapolis, 76% of white families own their homes, which makes for a gap of 51 percentage points, followed by Grand Rapids (78%; 45 percentage-point gap), Salt Lake City (72%; 44 percentage-point gap) and Milwaukee (70%; 43 percentage-point gap). The metro-level data in this report is from 2018, the most recent year for which it’s available.
In Washington, DC, the metro with the highest Black homeownership rate, just over half of Black families (51%) own their home. It’s followed by Birmingham (50%) and Richmond, VA (49%). Washington, DC also has the smallest homeownership gap, with 72% of white families owning their home for a 21 percentage-point gap. Austin has the next-smallest gap, with a rate of 43% for Black families and 65% for white families, followed by Los Angeles (33% versus 58%).
The Black homeownership rate has declined in most metros since 2012
Fewer or the same share of Black families owned their home in 2018 than 2012 in all but two of the metros included in this report. And in both places where the rate has gone up—Hartford, CT and Austin—it has only increased by 1 percentage point, from 42% to 43%. This report uses 2012 as a comparison point because that’s when the housing market started to recover from the Great Recession.
The homeownership rate for Black families has declined most in Oklahoma City, from 42% in 2012 to 36% in 2018. In five other metros, the share of Black families who own their homes dropped by 5 percentage points over that time period: Detroit, Jacksonville, Miami, Memphis and Milwaukee.
For more on metro-level homeownership rates, see the table at the end of this report.
Why Black homeownership rates are higher in some metros than others
“There are a lot of federal employment opportunities for Black individuals in DC, and those jobs provide good salaries that drive homeownership,” said local Redfin agent Thomas Mathis. “I also see a lot of parents passing homes on to their children. DC was predominantly Black at one time and a lot of those families have stayed in the area, which means their homes are still in the family. But there’s still plenty of room for improvement. One way to increase the Black homeownership rate is with understanding the power of owning a home. Plenty of Black families in the area have money, but often they haven’t been educated on how they could build wealth by purchasing a home.”
Chris Prescott, Redfin’s market manager for Minneapolis, said several factors have contributed to the low homeownership rate for Black families in the area.
“Minneapolis has a long history of segregation and housing inequality, and the homeownership gap between Black and white families can be traced back partly to discriminatory housing covenants that blocked Black families and other minorities from buying homes. Those policies were then exacerbated by redlining. Though the policies have been outlawed for over 50 years, the impact persists,” Prescott said. “Today, Black families in the area still earn significantly less money than white families do. That, combined with rising home prices and high rent in the Twin Cities, make it difficult to break into the housing market and bridge the gap.”
Racist housing policies, debt and other reasons behind the national homeownership gap
Discriminatory housing policies were prevalent across the U.S. in the first half of the 20th century. As Prescott noted, one such policy consisted of deeds that restricted the sale of homes to Black families and other minorities. Another one, redlining, effectively blocked many Black families from obtaining mortgage loans, with a Redfin analysis finding that families in redlined neighborhoods have missed out on $212,000 in home equity over the last 40 years. Although those racist policies have been outlawed, they are major reasons why Black families have unfairly missed out on so much personal wealth from property gains, which helps explain why such a large share of housing remains unaffordable for Black families.
Rising home prices and income gaps are also problematic throughout the country. Home prices in majority-Black neighborhoods across the U.S. rose at double the rate of those in majority-white neighborhoods (25% versus 12.5%) from 2012 to 2018, making it difficult to break into the market. And while incomes for Black and white households have risen at a similar pace during that time period, Black households had a much lower median income than white households in 2018 ($41,511 versus $67,937). A Redfin analysis found there wasn’t a single major metro area in 2018 where more than half the homes for sale were affordable to Black households earning the median income.
Nearly 8% of Black households with mortgages lost their homes to foreclosure between 2007 and 2009 versus 4.5% of white families, another factor in the current homeownership gap. Banks subsequently tightened lending standards, making it more difficult to obtain mortgages, particularly for Black families. Accordingly, a December Redfin survey of first-time homebuyers found that Black respondents were more likely than white respondents to want the government to ease lending standards (56% versus 42%).
Student debt is another obstacle for Black Americans. In a Redfin survey from February 2020, 45% of Black respondents said student debt prevented them from trying to buy a home sooner, versus 31% of white respondents. The survey had 232 responses from Black individuals out of more than 1,400 total responses.
Moving toward systemic change in the housing market
Narrowing the homeownership gap should be a priority for lawmakers and the real estate industry. “We can heal our society’s great wound only if Black people and white people live side by side, with the same schools, grocery stores and job opportunities,” Redfin CEO Glenn Kelman said in a recent blog post. “This requires every real estate agent to approach our jobs differently.”
To that end, Redfin has successfully campaigned to eliminate pocket listings that can prevent minority homebuyers from seeing the most desirable homes for sale and supported controversial business taxes to fund more housing, among other initiatives, but systemic change in the housing market requires commitment from the real estate and construction industries along with federal and local governments.
A closer look at metro-level homeownership rates for Black families
Homeownership Rates in the U.S. for Black Families, By Metro (Population over 1 million)
| Metro area | Black homeownership rate (2018) | Black homeownership rate (2012) | White homeownership rate (2018) | Median home-sale price (2018) | Percent increase in median home-sale price, 2012 to 2018 |
|---|---|---|---|---|---|
| Minneapolis, MN | 25% | 25% | 76% | $265,000 | 61% |
| Milwaukee, WI | 27% | 33% | 70% | $206,000 | 36% |
| Salt Lake City, UT | 28% | 30% | 72% | $315,000 | 63% |
| Las Vegas, NV | 29% | 33% | 62% | $270,500 | 124% |
| San Diego, CA | 30% | 30% | 61% | $569,995 | 68% |
| San Jose, CA | 31% | 34% | 65% | $1,175,000 | 117% |
| Seattle, WA | 32% | 33% | 65% | $479,500 | 78% |
| Portland, OR | 32% | 32% | 66% | $391,000 | 72% |
| Rochester, NY | 32% | 35% | 74% | $144,000 | 15% |
| Providence, RI | 32% | 32% | 68% | $267,500 | 45% |
| New York, NY | 32% | 32% | 67% | $403,000 | 24% |
| Buffalo, NY | 32% | 34% | 73% | $149,900 | 25% |
| Sacramento, CA | 33% | 36% | 67% | $395,000 | 99% |
| Grand Rapids, MI | 33% | 35% | 78% | $195,000 | 70% |
| Phoenix, AZ | 33% | 36% | 70% | $262,500 | 82% |
| Los Angeles, CA | 33% | 36% | 58% | $645,000 | 82% |
| Boston, MA | 33% | 33% | 69% | $455,000 | 40% |
| San Francisco, CA | 33% | 34% | 61% | $900,000 | 95% |
| Cincinnati, OH | 33% | 35% | 73% | $175,000 | 37% |
| Columbus, OH | 34% | 37% | 69% | $203,000 | 42% |
| Pittsburgh, PA | 35% | 36% | 74% | $165,100 | 22% |
| Indianapolis, IN | 36% | 40% | 73% | $178,000 | 42% |
| Cleveland, OH | 36% | 40% | 75% | $145,714 | 32% |
| Oklahoma City, OK | 36% | 42% | 70% | $170,000 | 20% |
| Tucson, AZ | 36% | 36% | 69% | $210,000 | 50% |
| Kansas City, MO | 37% | 42% | 72% | $210,000 | 42% |
| Louisville, KY | 37% | 39% | 74% | $187,000 | 30% |
| Dallas–Fort Worth, TX | 37% | 42% | 69% | $269,900 | 64% |
| Denver, CO | 38% | 41% | 70% | $405,000 | 76% |
| Tampa, FL | 38% | 42% | 71% | $224,990 | 87% |
| St. Louis, MO | 40% | 44% | 77% | $177,333 | 36% |
| Chicago, IL | 40% | 42% | 75% | $240,000 | 54% |
| Riverside, CA | 42% | 46% | 71% | $360,000 | 85% |
| Houston, TX | 42% | 46% | 72% | $236,990 | 44% |
| Detroit, MI | 42% | 47% | 78% | $177,000 | 121% |
| Hartford, CT | 43% | 42% | 77% | $219,500 | 11% |
| Austin, TX | 43% | 42% | 65% | $309,000 | 52% |
| Nashville, TN | 43% | 44% | 72% | $286,000 | 68% |
| Virginia Beach, VA | 44% | 47% | 72% | $229,900 | 25% |
| Charlotte, NC | 44% | 47% | 75% | $242,000 | 47% |
| Orlando, FL | 44% | 46% | 70% | $244,000 | 99% |
| Jacksonville, FL | 44% | 49% | 72% | $227,000 | 62% |
| San Antonio, TX | 44% | 46% | 71% | $223,458 | 40% |
| Miami, FL | 45% | 49% | 74% | $275,000 | 91% |
| Raleigh, NC | 45% | 48% | 74% | $282,500 | 40% |
| Memphis, TN | 46% | 51% | 75% | $177,000 | 48% |
| Baltimore, MD | 46% | 47% | 77% | $270,000 | 16% |
| New Orleans, LA | 47% | 47% | 73% | $215,000 | 34% |
| Atlanta, GA | 47% | 52% | 75% | $236,511 | 113% |
| Philadelphia, PA | 48% | 50% | 76% | $229,000 | 12% |
| Richmond, VA | 49% | 53% | 75% | $246,500 | 33% |
| Birmingham, AL | 50% | 53% | 78% | $199,900 | 33% |
| Washington, D.C. | 51% | 52% | 72% | $399,000 | 23% |
The post Minneapolis, Milwaukee & Salt Lake City Have the Lowest Black Homeownership Rates in the U.S., With Just One-Quarter of Black Families Owning Their Home appeared first on Redfin | Real Estate Tips for Home Buying, Selling & More.